
Measure actual use
See which restrooms, meeting rooms, and shared spaces receive the most use, and how demand changes throughout the day.

Occupancy-Driven Cleaning is a facility service approach that uses measured traffic and space usage to determine where and when cleaning is needed instead of relying only on fixed schedules. It gives BSCs a data-driven way to direct labor toward actual facility demand, reduce avoidable work, improve verified compliance, and convert better labor utilization into stronger contract economics.
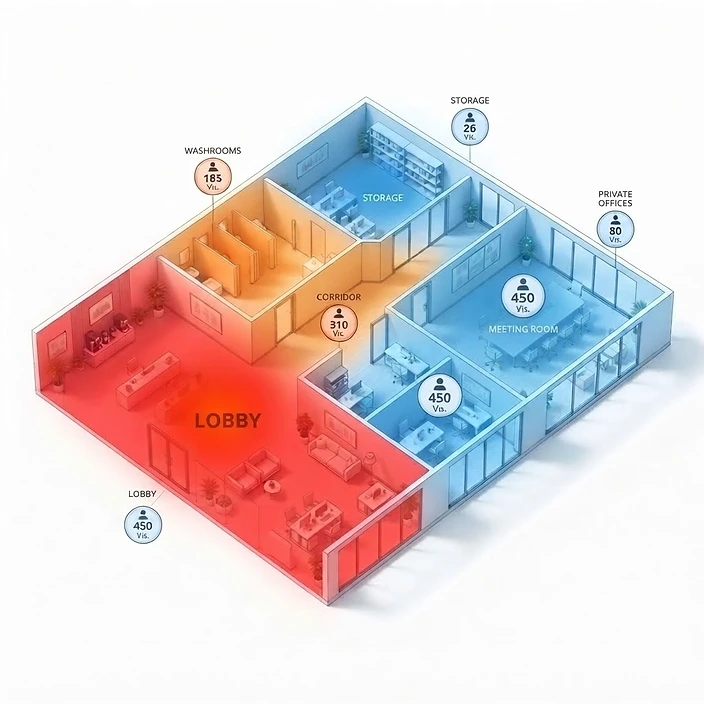
Footfall counters measure real occupancy—how often a space is used, by how many people, and when. Instead of cleaning and servicing on a fixed schedule, teams deploy based on actual need: high-traffic areas get more frequent attention, low-use areas aren't over-serviced, and every visit is logged automatically. The result is lower operational waste, better compliance, and a defensible record of every service event.
Demand-based cleaning matches cleaning resources to actual facility need. Occupancy-driven cleaning makes that need visible through measured foot traffic and space usage, helping teams decide where and when to focus service.
See which restrooms, meeting rooms, and shared spaces receive the most use, and how demand changes throughout the day.
Use agreed usage thresholds to prioritize busy areas and reduce avoidable work in lightly used spaces while maintaining contractual and hygiene requirements.
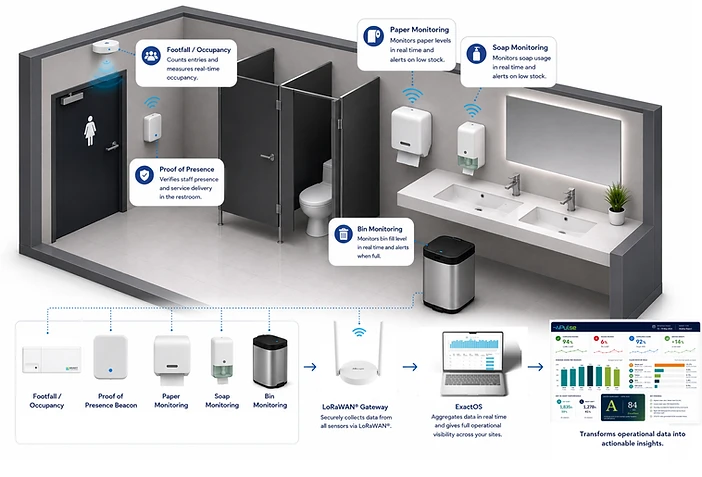
Connect occupancy data with hands-free Proof of Presence and AI-assisted inspections to document service presence and assess quality.
For building owners, this supports responsive service and clearer visibility into cleaning spend. For building service contractors, it helps direct productive capacity where it creates the most value. Within Value-Based Cleaning, demand signals, service verification, and quality evidence work together.
Demand-based cleaning adjusts cleaning priorities and service frequency according to actual need. Building usage, foot traffic, consumable levels, and observed conditions help teams decide where attention is needed while maintaining agreed service standards.
Demand-based cleaning is the approach: match cleaning resources to actual need. Occupancy-driven cleaning provides a key input by measuring how spaces are used. Contactless FM uses occupancy and usage thresholds to help teams prioritize service, giving busy areas timely attention and reducing avoidable work in lightly used spaces.
Demand-based cleaning can complement scheduled cleaning. Contractual requirements, hygiene standards, and mandatory tasks remain the service baseline. Occupancy data helps teams adjust priorities and additional service within those requirements; low occupancy alone does not mean a space needs no cleaning.
Occupancy data indicates where service may be needed. Hands-free Proof of Presence records a worker's arrival, departure, and time in the service zone. AI-assisted inspections can then assess cleaning quality. Together, these inputs connect demand, service presence, and the measured result within Value-Based Cleaning.
Occupancy-driven workflows make facility demand visible so operations teams can direct labor more intelligently and measure the effect.
Conceptual workflow. Exact occupancy technologies and service thresholds vary by contract.
The executive ROI model quantifies the opportunity through actual recovered hours, compliance improvement, margin expansion, and profit impact.
Reduce work that does not correspond to actual demand and move those labor hours toward high-priority service.
Pair occupancy-driven assignments with Proof of Presence so the contract can measure whether required service was delivered.
When wasted labor is reduced and service becomes more disciplined, the model shows how operational improvement can flow into financial performance.
Illustrative ROI-calculator output, not a guarantee. Actual results depend on labor structure, occupancy patterns, contract scope, baseline compliance, and execution.
Use your own revenue, labor, compliance, and margin assumptions.
